


Key Findings
- New York City ranks #3 among all 50 major U.S. cities for pedestrian danger, with 51.52% of all fatal crashes involving pedestrian deaths, nearly three times the rate of the safest city.
- New York City averages 116 pedestrian deaths annually, the second-highest raw death toll in the nation, trailing only Los Angeles (150).
- New York City recorded an 18% decrease in pedestrian fatalities from 2019 to 2023, dropping from 127 to 104 deaths, one of the few major cities to show sustained improvement.
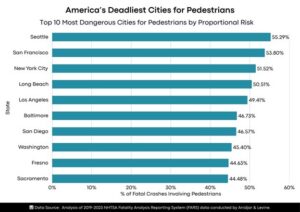 In New York City, crossing the street carries more risk than almost anywhere else in America. With more than half of all traffic deaths involving pedestrians, the city’s crowded crosswalks and bustling intersections have become a focal point of the national pedestrian safety crisis. For every two people killed on New York’s roads, at least one was on foot—a ratio exceeded only by Seattle and San Francisco among major American cities.
The study, conducted by Anidjar & Levine, examined fatal crashes across America’s 50 largest cities from 2019 to 2023. Cities were ranked by the percentage of fatal crashes involving pedestrian deaths, measuring proportional risk to pedestrians relative to all traffic fatalities.
New York City’s Five-Year Pedestrian Fatality Trend
| Year | Pedestrian Fatalities | Year-Over-Year Change |
| 2019 | 127 | — |
| 2020 | 97 | -24% |
| 2021 | 129 | +33% |
| 2022 | 121 | -6% |
| 2023 | 104 | -14% |
| 5-Year Total | 578 | — |
| Annual Average | 116 | — |
The 2020 pandemic year brought New York City’s lowest toll at 97 deaths, but 2021 rebounded to the highest figure at 129. The 2023 count of 104 deaths represents the second-lowest figure in the five-year study period.
Top 10 Most Dangerous Cities for Pedestrians
| Rank | City | State | % Fatal Crashes w/ Pedestrians | Avg. Annual Ped Deaths |
| 1 | Seattle | Washington | 55.29% | 19 |
| 2 | San Francisco | California | 53.80% | 18 |
| 3 | New York City | New York | 51.52% | 116 |
| 4 | Long Beach | California | 50.51% | 20 |
| 5 | Los Angeles | California | 49.41% | 150 |
| 6 | Baltimore | Maryland | 46.73% | 20 |
| 7 | San Diego | California | 46.57% | 46 |
| 8 | Washington | D.C. | 45.40% | 15 |
| 9 | Fresno | California | 44.63% | 27 |
| 10 | Sacramento | California | 44.48% | 26 |
New York City trails Seattle by 3.8 percentage points and San Francisco by 2.3 points, but leads fourth-place Long Beach by a single point. Only four U.S. cities see pedestrians account for more than half of all traffic deaths, and New York City is the largest among them.
Expert Commentary
Looking at the study, a spokesperson from Anidjar & Levine commented:
“New York City’s position as America’s third most dangerous major city for pedestrians reflects the unique challenges of the nation’s most densely populated urban environment. While the recent downward trend in fatalities is encouraging, the sheer volume of pedestrian deaths—averaging 116 per year—demands continued investment in infrastructure, enforcement, and Vision Zero initiatives to protect the millions who walk the city’s streets daily.”
New York City Year-Over-Year Fatality Changes
| Period | Starting Deaths | Ending Deaths | Change | % Change |
| 2019 to 2020 | 127 | 97 | -30 | -24% |
| 2020 to 2021 | 97 | 129 | +32 | +33% |
| 2021 to 2022 | 129 | 121 | -8 | -6% |
| 2022 to 2023 | 121 | 104 | -17 | -14% |
| 2019 to 2023 | 127 | 104 | -23 | -18% |
The 2020-2021 spike of +33% stands as New York City’s most alarming single-year change, adding 32 pedestrian deaths. The overall 18% reduction from 2019 to 2023 mirrors Seattle’s improvement and contrasts sharply with cities like Fort Worth (+130%) and Philadelphia (+110%).
New York City vs. Northeast and Major Metro Peers
| City | State | % Fatal Crashes w/ Pedestrians | Avg. Annual Ped Deaths | National Rank |
| New York City | New York | 51.52% | 116 | 3 |
| Baltimore | Maryland | 46.73% | 20 | 6 |
| Washington | D.C. | 45.40% | 15 | 8 |
| Boston | Massachusetts | 41.75% | 9 | 14 |
| Philadelphia | Pennsylvania | 40.29% | 51 | 19 |
New York City leads all Northeast corridor cities by a substantial margin, with a proportional rate 4.8 points higher than second-place Baltimore. Despite Philadelphia recording significant raw deaths (51 annually), New York City’s pedestrian fatality percentage exceeds it by more than 11 points.
Top 10 Cities by Raw Pedestrian Death Toll
| Rank | City | State | Avg. Annual Ped Deaths | % Fatal Crashes w/ Pedestrians | National Rank (%) |
| 1 | Los Angeles | California | 150 | 49.41% | 5 |
| 2 | New York City | New York | 116 | 51.52% | 3 |
| 3 | Phoenix | Arizona | 103 | 40.05% | 20 |
| 4 | Houston | Texas | 99 | 35.20% | 28 |
| 5 | Dallas | Texas | 68 | 34.90% | 30 |
| 6 | Memphis | Tennessee | 62 | 31.86% | 36 |
| 7 | San Antonio | Texas | 60 | 35.70% | 26 |
| 8 | Chicago | Illinois | 60 | 35.12% | 29 |
| 9 | Philadelphia | Pennsylvania | 51 | 40.29% | 19 |
| 10 | San Diego | California | 46 | 46.57% | 7 |
New York City ranks second nationally in raw pedestrian deaths, trailing only Los Angeles by 34 fatalities annually. However, New York City’s proportional rate of 51.52% significantly exceeds Los Angeles (49.41%), indicating higher relative risk for pedestrians despite fewer total deaths.
Cities With Similar Population Density: Risk Comparison
| City | State | Avg. Annual Fatal Crashes | Avg. Annual Ped Deaths | % Ped Fatalities |
| New York City | New York | 224 | 116 | 51.52% |
| San Francisco | California | 34 | 18 | 53.80% |
| Boston | Massachusetts | 21 | 9 | 41.75% |
| Washington D.C. | District of Columbia | 33 | 15 | 45.40% |
| Chicago | Illinois | 172 | 60 | 35.12% |
Among America’s densest major cities, New York City’s pedestrian fatality percentage ranks second only to San Francisco. Despite Chicago having comparable fatal crash volumes (172 vs. 224), New York City’s pedestrian death share exceeds Chicago’s by 16.4 percentage points.
New York City’s Pandemic Impact: Before, During, and After
| Period | Years | Total Pedestrian Deaths | Annual Average | Trend |
| Pre-Pandemic | 2019 | 127 | 127 | Baseline |
| Pandemic | 2020 | 97 | 97 | -24% from baseline |
| Post-Pandemic Surge | 2021 | 129 | 129 | +33% from 2020 |
| Recovery | 2022-2023 | 225 | 113 | -13% from 2021 peak |
The pandemic brought a significant 24% reduction in pedestrian deaths, but 2021 erased all gains with the highest toll in the study period. The 2022-2023 recovery averaging 113 deaths annually suggests New York City is stabilizing below pre-pandemic levels.
Methodology
This analysis utilized data from the NHTSA Crash Report Sampling System via the CDAN Query Tool, examining fatal motor vehicle traffic crashes involving at least one pedestrian fatality across the 50 most populous U.S. cities for calendar years 2019 through 2023. For each city, total pedestrian fatalities were summed across all five years and divided by five to calculate the average annual pedestrian deaths, which were then divided by the average annual fatal crashes to determine the percentage of fatal crashes involving pedestrians. Cities were ranked from highest to lowest percentage, with this metric measuring proportional risk to pedestrians relative to all traffic deaths.
Data Sources
• NHTSA CDAN Query Tool: https://cdan.dot.gov/query
• NHTSA Traffic Safety Facts 2023: https://crashstats.nhtsa.dot.gov/Api/Public/ViewPublication/813727
• CDC MMWR Pedestrian Death Rates Study (March 2025): https://www.cdc.gov/mmwr/volumes/74/wr/mm7408a2.htm
• Governors Highway Safety Association (GHSA) Pedestrian Fatalities Report: https://www.ghsa.org/resource-hub/pedestrian-traffic-fatalities-2024-data
• Research Dataset: https://docs.google.com/spreadsheets/d/1rEO9jIZ2SutfZ5NsLcODYyWlgscgq5BiIn3mEE42Z3A/edit?gid=0#gid=0
• Study by: https://www.anidjarlevine.com/
About Anidjar & Levine
Anidjar & Levine is a personal injury law firm with extensive experience representing victims of serious traffic injuries and wrongful death, including pedestrian accidents. The firm is dedicated to protecting clients’ rights and helping them receive full compensation for their injuries.