
Lowest per capita rate among major cities, yet 36th nationally due to population scale
| Key Findings |
| ● New York City ranks 36th nationally for Urban Speeding Risk with a score of 11.14, despite having one of the lowest per capita crash rates in the study. |
| ● NYC’s crash rate of 8.19 per million residents is 75.0% below the 50 city average and the fourth lowest among all 50 cities studied. |
| ● The city accounts for 16% of the combined population of the 50 largest U.S. cities but only 4.6% of speeding-related fatal crashes. |
 With 8.19 crashes per million residents, 75.0% below the 50 city average, NYC shows that dense, transit-rich urban environments can significantly reduce speeding fatalities. However, the city’s 8.2% year-over-year increase and sheer population scale place it in the middle of the pack among the 50 largest metros.
A study conducted by Stanley Law Offices analyzed speeding-related fatal crash data from the National Highway Traffic Safety Administration’s Fatality Analysis Reporting System (FARS) via the CDAN Query Tool across the 50 largest U.S. cities by population. The analysis period spans 2019 through 2023, calculating five-year averages to account for annual fluctuations.
New York City: By the Numbers
| Metric | Value |
| National Rank | 36th of 50 cities |
| Urban Speeding Risk Score | 11.14 |
| Population (2023 estimate) | 7,936,530 |
| Average Annual Speeding Crashes (2019–2023) | 65.0 |
| Rank for Total Crash Volume | 5th in nation |
| Crashes Per Million Residents | 8.19 |
| Rank for Per Capita Rate | 4th lowest (safest) |
| Year-Over-Year Change (2022 to 2023) | +8.2% |
| Comparison to 50 City Average Rate | 75.0% below average |
Why NYC Ranks 36th Despite Lowest Per Capita Rate
NYC’s 36th national ranking reflects its excellent per capita performance offset by a recent upward trend. The Urban Speeding Risk Score weighs two factors:
- Per Capita Crash Rate (60% weight): At 8.19 crashes per million, NYC scores exceptionally well — the fourth lowest rate among all 50 cities and 75.0% below the 50 city average.
- Year-Over-Year Trend (40% weight): The 8.2% increase from 2022 to 2023 adds to NYC’s risk score. While moderate compared to cities like Arlington (+70%), any upward trend contributes to overall risk.
Looking at the study, Joe Stanley, Founder of Stanley Law Offices commented:
| “New York City’s data tells a compelling story about urban design and speeding safety. With a per capita rate 75.0% below the 50 city average, NYC demonstrates that dense, transit-oriented cities can dramatically reduce speeding fatalities. However, the 8.2% increase in 2023 is a warning sign. Even the safest cities must remain vigilant — Boston achieved a 50% reduction last year, proving that continued improvement is possible.”
— Joe Stanley, Founder, Stanley Law Offices |
National Context: Top 10 Cities by Speeding Risk Score
The table below shows the 10 highest-risk cities by Urban Speeding Risk Score. NYC (ranked 36th) is not among the top 10, underscoring that its high crash volume is a function of population scale, not elevated per capita risk.
| Rank | City | State | Avg. Annual Crashes | Crashes Per Million | % Change 2022–23 | Risk Score |
| 1 | Kansas City | Missouri | 39.0 | 76.12 | +15.8% | 69.02 |
| 2 | Detroit | Michigan | 47.8 | 75.89 | +15.9% | 68.91 |
| 3 | Tucson | Arizona | 33.4 | 60.69 | +27.3% | 63.43 |
| 4 | Arlington | Texas | 11.8 | 29.41 | +70.0% | 63.18 |
| 5 | Raleigh | North Carolina | 12.2 | 24.72 | +69.2% | 59.04 |
| 6 | Memphis | Tennessee | 33.6 | 55.30 | +27.0% | 59.04 |
| 7 | Tulsa | Oklahoma | 19.0 | 46.26 | +35.0% | 56.46 |
| 8 | Sacramento | California | 17.0 | 32.26 | +50.0% | 54.00 |
| 9 | Nashville | Tennessee | 23.2 | 33.79 | +40.0% | 49.50 |
| 10 | Portland | Oregon | 19.0 | 30.88 | +42.9% | 48.83 |
For comparison, NYC’s per capita rate of 8.19 is dramatically lower than every city in the top 10. The lowest rate in the top 10 is Raleigh at 24.72 , still 3× higher than NYC. This confirms that NYC’s moderate overall ranking stems from its recent upward trend and population scale, not per capita risk.
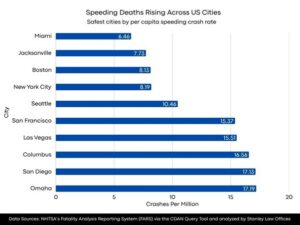
Safest Cities: Lowest Per Capita Speeding Crash Rates
NYC ranks fourth nationally for lowest per capita speeding crash rate, behind only Miami, Jacksonville, and Boston.
| Rank | City | State | Population | Crashes Per Million | Risk Score (Rank) |
| 1 | Miami | Florida | 464,655 | 6.46 | −9.20 (48th) |
| 2 | Jacksonville | Florida | 1,008,485 | 7.73 | 6.10 (39th) |
| 3 | Boston | Massachusetts | 639,411 | 8.13 | −22.16 (50th) |
| 4 | New York City | New York | 7,936,530 | 8.19 | 11.14 (36th) |
| 5 | Seattle | Washington | 764,753 | 10.46 | 36.82 (15th) |
| 6 | San Francisco | California | 767,968 | 15.37 | −4.21 (44th) |
| 7 | Las Vegas | Nevada | 670,352 | 15.51 | −12.26 (49th) |
| 8 | Columbus | Ohio | 917,679 | 16.56 | −4.99 (45th) |
| 9 | San Diego | California | 1,389,672 | 17.13 | 3.30 (41st) |
| 10 | Omaha | Nebraska | 477,053 | 17.19 | 20.69 (28th) |
NYC is by far the largest city among the 10 safest by per capita rate. Boston (3rd) and Miami (1st) rank lower overall due to declining trends, while NYC’s 8.2% increase keeps it at 36th for overall risk despite excellent per capita performance.
Northeast Regional Comparison
Among major Northeast cities, the region generally performs well compared to national averages. NYC ranks highest in the region for overall speeding risk.
| City | State | Avg. Annual Crashes | Crashes Per Million | % Change 2022–23 | Risk Score (Rank) |
| New York City | New York | 65.0 | 8.19 | +8.2% | 11.14 (36th) |
| Washington | D.C. | 14.0 | 20.46 | +18.2% | 26.51 (26th) |
| Philadelphia | Pennsylvania | 44.6 | 29.40 | −14.3% | 15.01 (34th) |
| Baltimore | Maryland | 14.0 | 25.30 | −8.3% | 15.18 (33rd) |
| Virginia Beach | Virginia | 11.4 | 25.35 | −26.7% | 4.75 (40th) |
| Boston | Massachusetts | 5.2 | 8.13 | −50.0% | −22.16 (50th) |
Regional success: Boston achieved a 50% reduction in speeding crashes, ranking as the safest city nationally (50th). Virginia Beach (−26.7%) and Philadelphia (−14.3%) also show improvement.
NYC and D.C. increasing: Both NYC (+8.2%) and Washington (+18.2%) saw increases, bucking the regional trend of improvement.
Methodology
Crash data was obtained from the National Highway Traffic Safety Administration’s Fatality Analysis Reporting System (FARS) via the CDAN Query Tool. The dataset includes nationally representative estimates of speeding-related fatal crashes occurring on urban roads within city limits for each of the 50 largest U.S. cities by population. NHTSA defines speeding-related fatal crashes as incidents that involve speeding as a contributing factor.
The 50 city average baseline used for per capita comparisons is 32.76 crashes per million population, calculated as the simple average of per capita rates across all 50 cities in this study.
Data Sources
FARS via the CDAN Query Tool: https://cdan.dot.gov/query
Research by: https://stanleylawoffices.com/
Research Dataset: https://docs.google.com/spreadsheets/d/1ZDRNgBcW4-on5axQZLJUftx6mmHxY0WnDOcxiX4-yh0/
About Stanley Law Offices
This study was conducted by Stanley Law Offices, a personal injury law firm representing people injured in serious accidents.
For more information, visit stanleylawoffices.com