From the rocky cliffs of the Hudson Highlands to the bustling neighborhoods of Queens, New York is a state of contrasts. Its environment encompasses mountain wilderness, fertile farmland, and one of the most densely populated urban areas in the world. You can travel from a quiet Adirondack lake surrounded by pine forests to a subway entrance in Times Square in the same day. This diversity makes the state’s natural and built environments rich in character, but it also creates serious challenges for environmental management.
Rising sea levels threaten coastal neighborhoods. Industrial history has left pollution in rivers and harbors. Extreme storms bring flooding to both cities and rural valleys. Urban heat affects public health, especially in the summer. Preserving such a varied landscape requires constant observation, and increasingly, that means turning to the clear and consistent view provided by satellites.
Why Satellite Data Matters in Environmental Monitoring
For decades, satellites have been quietly building a visual history of Earth. Platforms that provide access to Landsat images, among other satellite data, have allowed scientists to monitor changes in forests, waterways, coastlines, and cities with an unmatched combination of detail and scale. The advantage lies in consistency: the same location can be imaged again and again over years, revealing patterns that might go unnoticed on the ground.
These images are not just pictures but measurements of light reflected from the Earth’s surface, broken into spectral bands that can reveal vegetation stress, water pollution, soil moisture, and even subtle shifts in land use. Researchers use them to track urban heat, measure vegetation health, study the movement of sediment in rivers, and monitor disaster impacts. In environmental science, the ability to step back and see the full picture often makes the difference between reacting late and acting in time.
Satellite Insights in the Context of New York
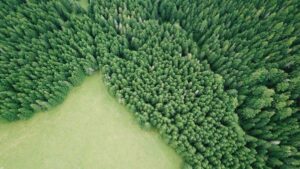
In New York State, the applications of Landsat data stretch from city streets to rural fields. The technology allows researchers to measure vegetation loss in the Adirondacks, map saltwater intrusion in coastal wetlands, and identify heat islands in New York City. With summer temperatures rising, heat-mapping projects have helped city agencies plan tree-planting initiatives and cooling centers in neighborhoods most at risk.
By analyzing reflectance data from the water’s surface, scientists can assess turbidity levels in places like New York Harbor, detecting algal blooms or sediment runoff after heavy rains. This work supports water quality improvement efforts and helps identify pollution sources.
Flood mapping is another critical use. After major storms, satellites can provide a rapid overview of inundated areas even when they are inaccessible on foot. In 2025, a satellite-based radar study published in Nature Cities revealed that New York City is sinking between 2 to 10 millimeters per year due to groundwater extraction and other factors, raising concerns about growing vulnerabilities in infrastructure and flood resilience.
Outside the city, agricultural areas rely on satellite data to monitor soil moisture, crop health, and drought conditions. In vineyards along the Finger Lakes, imagery can help growers manage irrigation more efficiently, while in the Catskills, it assists in forest health assessments that directly affect the water quality of New York City’s reservoirs.
Accessing and Using Landsat 8 Data for New York
For those working to understand the state’s environmental conditions, Landsat 8 data is an invaluable resource. On the EOSDA LandViewer platform, users can search for Landsat and other imagery by date and location, making it possible to focus on specific events or seasons. The process is straightforward for anyone learning how to get landsat data, with tools that allow filtering by cloud cover, spectral bands, or index type.
Once accessed, the imagery can be enhanced using band combinations and environmental indices. For example, vegetation indices highlight plant health, while water indices can help reveal changes in shoreline or water clarity. In New York’s agricultural regions, this data can detect drought stress weeks before it appears to the naked eye, giving farmers a chance to act early. In urban settings, planners can track the growth or loss of green space, helping guide zoning and development decisions.
Another advantage lies in the ability to compare images over time. With historical archives and availability of recent Landsat satellite imagery, users can create time-series analyses that reveal decades-long changes. This might mean tracking how New York City’s waterfront has evolved, documenting the expansion of solar farms in upstate counties, or monitoring the slow retreat of glaciers in the Adirondacks.
The platform’s mosaic feature allows analysts to merge multiple images for a broader view, which is useful when studying the spread of invasive plant species across large regions or examining the aftermath of major storms that impact wide areas. Time-lapse animations can then bring these changes to life, turning years of environmental data into a clear visual story.
Looking Ahead: Satellites and the Future of New York’s Environment
As the impacts of climate change accelerate, satellite imagery will become even more critical for New York. Higher-resolution sensors and faster revisit times will enable monitoring to happen in near real time. This could mean detecting harmful algal blooms in the Hudson River before they spread, tracking ice cover changes on the Great Lakes, or monitoring post-storm recovery in coastal communities within hours rather than days.
Integration of satellite data into everyday decision-making will likely expand. Local governments may use it to verify compliance with environmental regulations. Nonprofits may rely on it to track restoration projects. Businesses may incorporate it into sustainability reporting, ensuring that their environmental claims are backed by objective evidence.
Author:
Kateryna Sergieieva has a Ph.D. in information technologies and 15 years of experience in remote sensing. She is a scientist responsible for developing technologies for satellite monitoring and surface feature change detection. Kateryna is an author of over 60 scientific publications.